Introduction
“We’re almost full” is what most PG owners say when asked about occupancy. But almost full on which day? Counting which beds? And what about the two beds that sat empty for three weeks while the room was being repaired?
PG bed utilization gives you a precise answer. It tells you what share of your beds actually earned rent over a given period, and it’s the number behind almost every other decision in your business, from pricing to staffing to expansion. This guide covers the formulas, a worked example with real numbers, the mistakes that distort the result, and practical ways to improve it. A notebook is enough to start, though PG and hostel management software makes the counting easier once you have more than a few rooms.
What Is PG Bed Utilisation?
PG bed utilization is the share of your available beds that are occupied by paying tenants over a given period. To calculate it, divide occupied bed-days by available bed-days and multiply by 100. For example, if 40 beds are available for 30 days and 1,020 bed-days are occupied, utilization is 85%.
You’ll often hear it called occupancy rate. The two terms mostly mean the same thing in a PG. The difference is in how carefully you count.
Two Ways to Calculate PG Bed Utilization
Method 1: The Quick Snapshot
This gives you the picture on a single day.
Bed utilization (%) = Occupied beds ÷ Total beds × 100
If 33 of your 40 beds have tenants today, that’s 33 ÷ 40 = 82.5%.
It’s fast and useful for a daily check. The weakness is that it’s only one day. A PG that’s full on the 1st and half empty by the 20th can look healthy on the wrong date.
Method 2: The Bed-Day Method
This is more accurate because it accounts for beds that fill or empty during the month.
Bed utilization (%) = Occupied bed-days ÷ Available bed-days × 100
A bed-day is one bed for one day. Here’s how to get each number:
- Available bed-days: total beds × days in the period
- Occupied bed-days: add up the number of beds occupied on each day
So a 40-bed PG over 30 days has 1,200 available bed-days. If tenants occupied 1,020 of those bed-days, utilization is 1,020 ÷ 1,200 = 85%.
You don’t need to count day by day if your records show move-in and move-out dates. For each tenant, count how many days they stayed in the period, then add them up.
A Worked Example
These numbers are made up to show the method. Swap in your own.
A PG has 40 beds, and the average rent is ₹7,000 per bed per month.
| Measure | Calculation | Result |
|---|---|---|
| Available bed-days (30 days) | 40 × 30 | 1,200 |
| Occupied bed-days | From move-in/move-out dates | 1,020 |
| Bed utilization | 1,020 ÷ 1,200 | 85% |
| Equivalent fully occupied beds | 1,020 ÷ 30 | 34 beds |
| Rent billed | 34 × ₹7,000 | ₹2,38,000 |
| Rent if every bed were full | 40 × ₹7,000 | ₹2,80,000 |
| Vacancy loss | ₹2,80,000 − ₹2,38,000 | ₹42,000 |
That last line is the one worth staring at. Those 15 empty percentage points cost this owner ₹42,000 in a single month. Utilization isn’t just a percentage. It’s money you can see.
Adjusting for Beds You Can’t Rent
Not every bed is available all month. Some are under repair, reserved for staff, or taken out of use for renovation. Counting them as “available” makes your utilization look worse than it really is. Counting them as normal vacancy hides a maintenance problem.
The fix is to track both numbers.
- Gross utilization: against all beds you own
- Net utilization: against only the beds you could actually rent
Using the same PG, suppose two beds were under repair all month. Available bed-days drop to 38 × 30 = 1,140. Net utilization is 1,020 ÷ 1,140 = about 89.5%.
Neither number is wrong. Gross utilization shows how well the building is working overall. Net utilization shows how well you sold what you had. If the two are far apart, look at your repair turnaround.
Other Numbers That Make Utilization More Useful
Utilization alone doesn’t tell you whether the PG is doing well. Pair it with a few related measures.
Revenue Utilization
This compares what you actually collected with what you could have earned.
Revenue utilization (%) = Rent collected ÷ Rent at full occupancy × 100
A PG can have 90% of its beds filled and still collect much less if tenants pay late or discounts are widespread. If your billed rent is ₹2,38,000 and you collected ₹2,10,000, your collection efficiency on billed rent is about 88%.
Rent Per Available Bed
Rent per available bed = Total rent collected ÷ Total available beds
This helps you compare months or buildings fairly, even when the bed counts differ.
Utilization by Room Type
If you have single, double and triple sharing rooms at different rents, check each type separately. You may find triple-sharing beds fill instantly while single rooms sit empty. That’s useful information for pricing.
Break-Even Occupancy
Break-even occupancy = Monthly costs ÷ Average rent per bed
If your costs are ₹2,02,000 and rent is ₹7,000 per bed, you need roughly 29 beds filled to break even. That’s 72.5% of 40 beds. Utilization above that number is profit. Below it, you’re running at a loss.
What Counts as Good Utilization?
There’s no honest universal answer. It depends on your city, locality, season and tenant type. A student PG near a college will swing more through the year than a working-professionals PG near an office hub.
Instead of chasing a number you read somewhere, compare against:
- Your break-even occupancy. This is your minimum.
- Your own history. Is this month better or worse than the same month last year?
- Your trend. Is it climbing, flat or slipping?
A steady 85% with healthy collections is a better sign than a 95% that crashes every few months.
Common Mistakes That Distort the Numbers
- Counting booked beds as occupied. A tenant who has paid an advance but hasn’t moved in isn’t occupying a bed yet.
- Counting people instead of beds. A guest staying a few nights shouldn’t be treated as a full tenant.
- Including mess-only members. Someone who only takes meals isn’t using a bed. Keep them out of your bed count.
- Forgetting room shifts. If a tenant moves from one bed to another, make sure you aren’t counting both.
- Ignoring notice periods. A tenant who has given notice still occupies the bed until the last day.
- Measuring only on the 1st. Month-start numbers can hide mid-month drops.
How to Improve PG Bed Utilization
Once you can measure it, you can improve it. These are the levers that usually matter most.
- Shorten the gap between tenants. Every empty day costs about a thirtieth of a month’s rent. Clean and repaint quickly, and start promoting the bed as soon as you know about a vacate.
- Fix beds fast. A bed that sits “under repair” for weeks is a hidden vacancy. A maintenance log helps you catch these.
- Track how long beds stay empty. A bed vacant for 45 days needs a different response than one vacant for 5.
- Review pricing by room type. If one type fills instantly, you may be underpriced. If another lingers, it may be overpriced or poorly presented.
- Plan around your seasons. Look at your own move-in and move-out patterns, and start marketing before the slow months, not during them.
- Keep current tenants longer. Retention is cheaper than finding new tenants. Respond to complaints quickly, and settle deposits cleanly when people do leave.
Calculating Bed Utilization With Software
Doing the bed-day math in a notebook works when you have ten beds. With multiple floors or buildings, it gets tedious and error-prone, and the numbers depend on every move-in and move-out being recorded correctly.
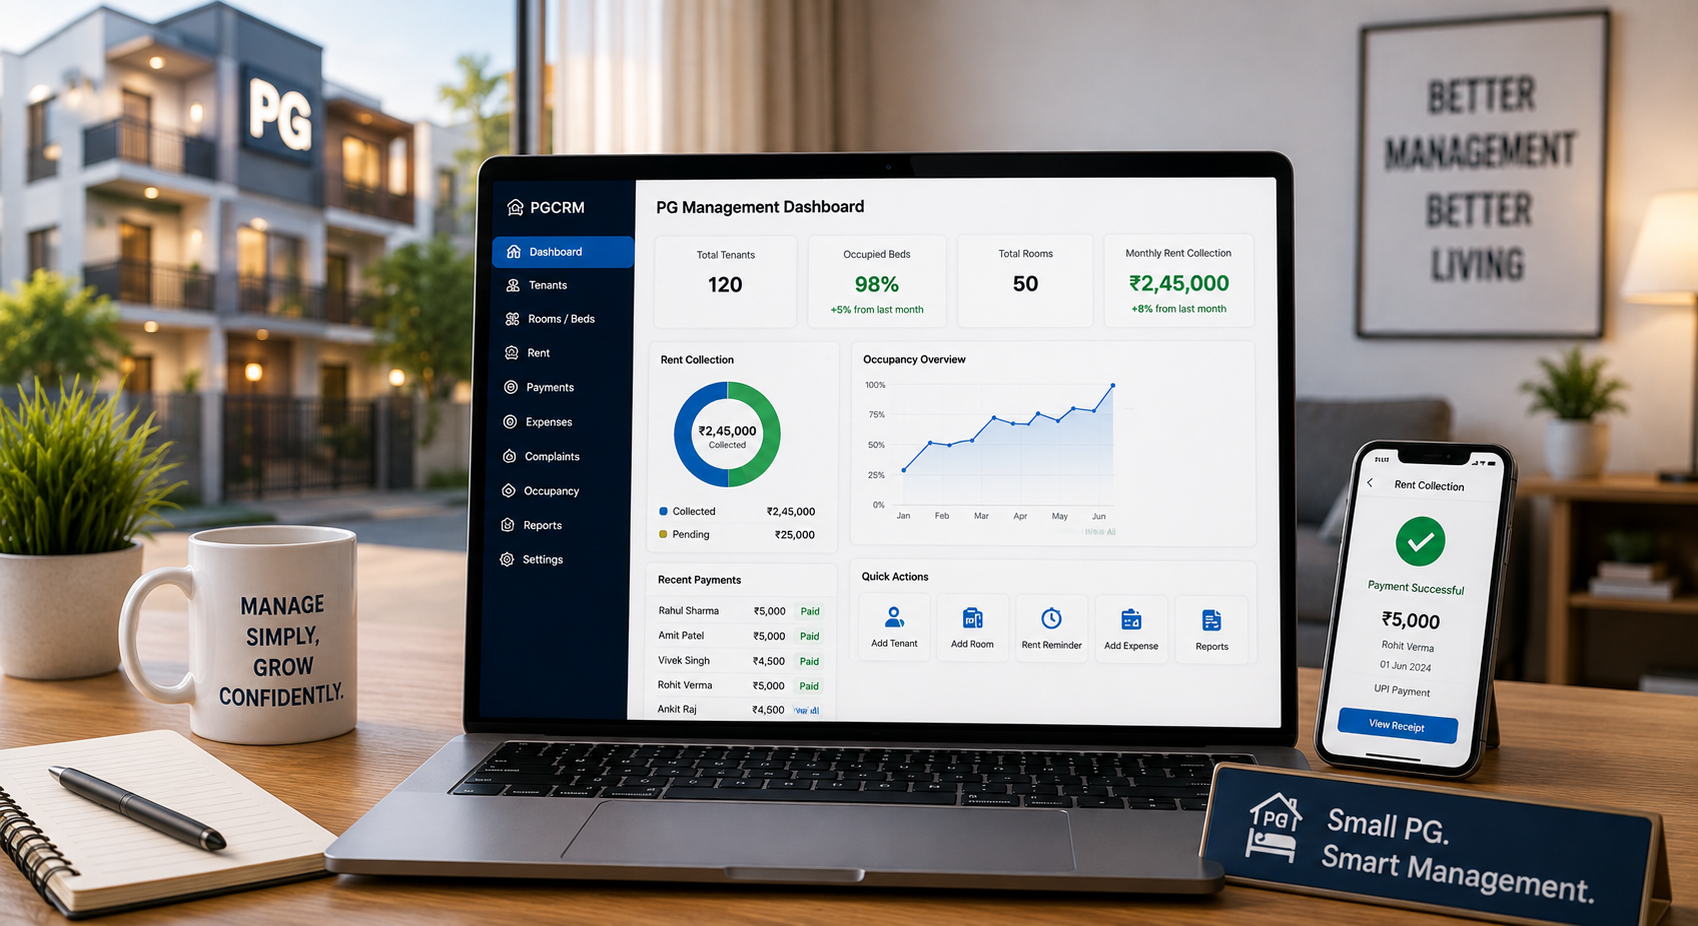
PG management software keeps those records in one place. PGCRM, for instance, lets you add your buildings, floors, rooms and beds once, then shows each bed as full, free or under repair. The dashboard shows how many beds are occupied out of the total, along with check-ins and check-outs for the day. It also provides occupancy, income and expense reports, and it handles room shifts, vacates and settlements, so your records stay in sync with what’s actually happening. You can see more on the PGCRM features page.
Here’s how the two approaches compare:
| Task | Manual records | PG management software |
|---|---|---|
| Counting occupied beds | Walk the building or flip through a register | Live view of full, free and repair beds |
| Tracking move-ins and move-outs | Easy to miss or record late | Recorded with each tenant |
| Occupancy history | Rebuilt by hand each month | Occupancy reports |
| Multiple buildings | Separate registers or sheets | One view across buildings |
| Mess-only members | Easy to count by mistake | Handled as a separate admission type |
The bed-day method above is still a good monthly check, even if your software gives you the basic percentage at a glance.
Frequently Asked Questions
How do you calculate bed utilization in a PG?
Divide occupied beds by total beds and multiply by 100 for a quick snapshot. For a more accurate monthly figure, divide occupied bed-days by available bed-days. For example, 1,020 occupied bed-days out of 1,200 available gives 85%. The bed-day method accounts for tenants who move in or out mid-month.
What is the difference between bed utilization and occupancy rate?
In a PG, they usually mean the same thing: the share of beds that are filled. Some owners use “occupancy” for a single-day count and “utilization” for the average over a period. What matters is using one method consistently, so you can compare months fairly.
Should beds under repair count in bed utilization?
Track both ways. Gross utilization counts all your beds and shows overall building performance. Net utilization excludes beds that can’t be rented, such as those under repair, and shows how well you sold what was available. A large gap between the two usually points to slow maintenance.
What is a good bed utilization rate for a PG?
There’s no single right number, because it varies by city, area and tenant type. A better benchmark is your own break-even occupancy: monthly costs divided by average rent per bed. Anything above that is profit. Also compare against your past months and watch the trend.
How often should I calculate PG bed utilization?
Check the quick snapshot daily or weekly, and calculate the bed-day figure once a month. Review it by building and by room type every quarter. Regular tracking helps you spot slow periods early, so you can adjust pricing or marketing before they cost you much rent.
Can I track PG bed utilization in Excel?
Yes. List each tenant with a move-in and move-out date, count the days each stayed in the month, and add them up. Divide by total bed-days. It works well for a small PG. As you add buildings and tenants, keeping the sheet accurate becomes harder, and dedicated software can save time.
Conclusion
PG bed utilization comes down to a simple idea: how many of your beds earned rent, out of the beds you had. Use the quick snapshot for daily checks, the bed-day method for a true monthly figure, and revenue measures to see what the percentage means in rupees. Then compare against your break-even occupancy and your own trend, not someone else’s benchmark.
The numbers are only as good as your records. PG management software such as PGCRM keeps rooms, beds, tenants and occupancy in one place, so the counting takes minutes instead of hours. Explore PGCRM to simplify your PG and hostel management.