How to Build a Sales Performance Dashboard to Track Team Performance
Most sales managers know the feeling. It is 6 PM, targets are due, and you are still asking agents how many calls they made and which leads are pending. The numbers sit in Excel sheets, call logs and WhatsApp messages, and nobody has one clear picture.
A well-built sales performance dashboard fixes this by putting your team’s key numbers on one screen. If your team makes outbound calls, a real-time analytics dashboard built for telecalling teams can pull this data from your daily calling work automatically. This guide explains what a dashboard should show, how to build one step by step, and which mistakes to avoid.
What Is a Sales Performance Dashboard?
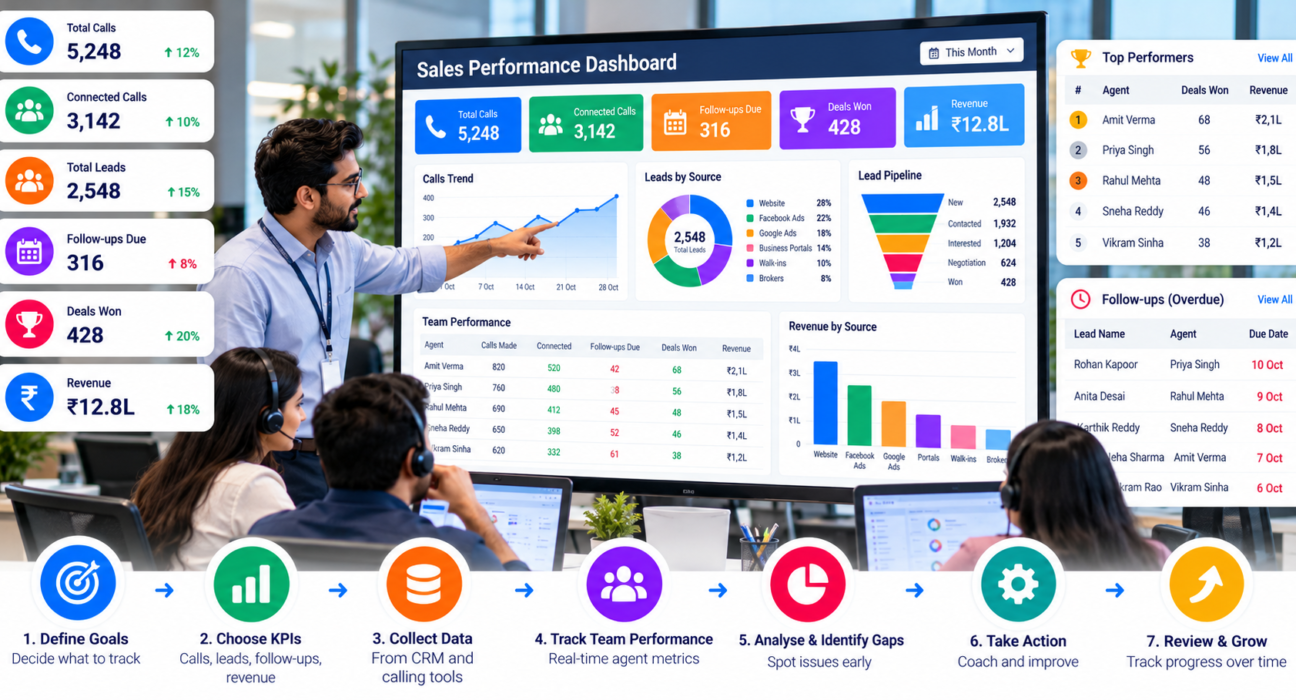
A sales performance dashboard is a single screen that shows the most important sales metrics for your team, such as calls made, leads contacted, follow-ups pending, deals won and revenue. It lets managers see how each agent and the whole team are performing without collecting reports manually.
A good dashboard answers three questions quickly:
- What is happening right now?
- Who is on track and who needs help?
- Where are leads getting stuck?
It is not a report you prepare once a month. It is a working tool you open every day.
Why Your Sales Team Needs One
Without a dashboard, performance reviews depend on memory and manual reports. That leads to problems:
- Late problem detection. You find out an agent is struggling only when the month ends.
- Unfair comparisons. Without common metrics, it is hard to compare agents fairly.
- Missed follow-ups. Leads go cold because nobody sees them overdue.
- Slow decisions. Managers spend time collecting data instead of coaching.
A dashboard does not make a team sell more by itself. It makes problems visible early so you can act on them.
Who Should Use a Sales Dashboard?
A dashboard is useful for:
- Sales managers and team leaders, who need daily visibility on agents and targets.
- Business owners, who want a quick view of pipeline and revenue.
- Telecalling and call centre teams, where call volume and follow-up discipline drive results.
- Agents themselves, who benefit from seeing their own targets and progress.
Step 1: Define What You Want to Track
Start with the questions you want answered, not the charts. A dashboard with 30 numbers is as useless as having none.
Ask yourself:
- What is our main goal this quarter: more conversations, more conversions or more revenue?
- Which actions by agents lead to that goal?
- Which decisions will this dashboard help me make?
For a calling team, the goal is usually a mix of activity, quality and outcomes.
Step 2: Choose the Right Sales KPIs
Pick 8 to 12 metrics and group them into three types. Here is a practical starting set for an outbound sales team.
| Metric Type | KPI | What It Tells You |
|---|---|---|
| Activity | Calls made per agent | Whether the team is putting in the effort |
| Activity | Talk time and idle time | How much of the working day is spent on conversations |
| Quality | Connection and answer rate | How many calls reach a real person |
| Quality | Call quality score | Whether conversations are being handled well |
| Follow-up | Follow-ups due and overdue | Whether leads are being chased on time |
| Pipeline | Leads by stage | Where leads are getting stuck |
| Outcome | Win rate | The share of leads that become customers |
| Outcome | Average deal size | The typical value of a closed deal |
| Outcome | Revenue by agent and by lead source | Who and what is bringing in money |
Tip: Track both activity and outcome metrics. High call counts with a low win rate usually points to a pitch or lead quality problem, not an effort problem.
Step 3: Collect Your Data in One Place
A dashboard is only as reliable as its data. If calls are logged in one tool, leads sit in a spreadsheet and deals are noted on paper, you cannot build a trustworthy view.
Before building anything:
- Centralise leads. Bring leads from ads, portals, websites and sheets into one system.
- Log every call. Duration, outcome and notes should be recorded for each call, ideally automatically.
- Standardise lead stages. Agree on clear stage names such as New, Contacted, Interested, Negotiation, Won and Lost.
- Record deal values. Without them, you cannot measure revenue or average deal size.
This is where a CRM matters. Lead management software and calling software keep these records together, so your dashboard updates without manual entry.
Step 4: Design the Dashboard Layout
Keep the layout simple. Managers should understand it within ten seconds.
A practical layout:
- Top row: Four to five headline numbers (calls today, connected calls, follow-ups due, deals won, revenue this month).
- Middle section: Team and agent view. Show a leaderboard or table with each agent’s calls, talk time and conversions.
- Pipeline section: A stage-wise view of leads and their values.
- Bottom section: Trends over time, such as calls by hour of the day or conversion by lead source.
Design tips:
- Show targets next to actual numbers so progress is obvious.
- Use colour sparingly. Red and green for off-track and on-track is enough.
- Allow filters by date, agent, team and lead source.
- Keep one dashboard for managers and a simpler one for agents.
Step 5: Set Targets and Benchmarks
A number means little without context. Is 60 calls a day good? It depends on your product, lead quality and call length.
- Use your own past data to set realistic targets.
- Compare agents against team averages, not against unrelated industry figures.
- Review targets every month and adjust when lead quality or team size changes.
Step 6: Decide Who Sees What
Not everyone needs access to everything. Revenue data and the performance of the full team should be visible to managers and owners. Agents may only need their own numbers and the team leaderboard. Role-based access control helps you manage this without sharing sensitive data widely.
Step 7: Review It Daily and Weekly
A dashboard works only if it becomes a habit. A simple rhythm:
- Daily (10 minutes): Check calls, idle agents, overdue follow-ups and leads waiting for a first call.
- Weekly (30 minutes): Review conversion by agent and by lead source, then plan coaching.
- Monthly: Check targets, pipeline health and revenue trends.
For teams that want less manual checking, scheduled email summaries can deliver key numbers to managers automatically.
A Practical Example
This is a hypothetical example to show how a dashboard is used.
A real estate team has eight telecallers handling leads from property portals and Facebook ads. On Monday morning, the manager opens the dashboard and sees:
- Two agents have low talk time but high idle time.
- Thirty-five follow-ups are overdue, most of them assigned to one agent.
- Leads from one portal are being contacted but rarely reach the site visit stage.
The manager redistributes the overdue follow-ups, speaks to the two agents about their calling routine, and checks whether the lead quality from that portal needs review. None of this required a long report. The dashboard pointed to where the manager should look.
What a Dashboard Cannot Do
Be realistic about limitations:
- It cannot fix bad data. If agents skip logging outcomes, the numbers will mislead you.
- It does not replace coaching. A dashboard shows a problem. A manager still has to solve it.
- It can be gamed. If you reward only call volume, agents may make short, low-quality calls. Balance activity metrics with quality and outcome metrics.
Common Mistakes to Avoid
- Tracking too many metrics. Start with a handful and add more only when needed.
- Focusing only on activity. Calls made matters less than conversations that move leads forward.
- Ignoring follow-ups. Many deals are lost because leads were not called back on time.
- Using the dashboard to punish. If agents fear it, they may enter data to look good rather than to be accurate. Use it for coaching.
- Not defining metrics clearly. Decide what counts as a “connected call” or a “qualified lead” so everyone reads the numbers the same way.
- Building once and forgetting. Revisit your dashboard as your team and goals change.
Spreadsheet vs CRM Dashboard
| Factor | Spreadsheet | CRM Dashboard |
|---|---|---|
| Data entry | Manual | Mostly automatic from call and lead activity |
| Real-time view | No | Yes |
| Agent-level access control | Difficult | Built in through roles |
| Scales with team size | Poorly | Better |
| Setup cost | Free | Software subscription |
Spreadsheets are fine for a team of two or three. Once you have more agents, multiple lead sources and daily follow-ups, manual sheets become hard to keep accurate.
How TeleCallingCRM Can Help
If your team runs outbound calling, TeleCallingCRM includes dashboard and reporting features that cover many of the steps above. Based on the information on its website, these include:
- Live War Room. A real-time view of agents, leads and talk time, with utilisation and idle time.
- Reports and analytics. Connection and answer rates, leaderboards, hourly heatmaps and a custom report builder, with export to CSV, Excel or PDF.
- Sales pipeline and revenue. Deal values by lead, a stage-wise pipeline view, win rate and average deal size by agent and by source.
- Follow-ups and reminders. Callback scheduling with overdue alerts.
- AI call analysis. Automatic transcription, summaries and quality scores for calls.
- Targets and access control. Benchmarking and targets, along with role-based access.
You can read how these reports work in practice in our guide to the Live War Room and reports. If you manage a larger floor, the call centre CRM page explains how the platform fits that setup. For property teams, there is also a dedicated real estate CRM page.
As with any tool, check that the features match your process before committing. A trial or demo is a sensible way to test this with your own data.
Frequently Asked Questions
What is a sales performance dashboard?
It is a visual screen that shows key sales metrics, such as calls made, follow-ups, pipeline stages, deals won and revenue. Managers use it to track how each agent and the whole team are performing against targets, without preparing manual reports.
What KPIs should a sales dashboard include?
Include a mix of activity, quality and outcome metrics. Common ones are calls made, talk time, connection rate, follow-ups due, leads by stage, win rate, average deal size and revenue by agent. Start with 8 to 12 and avoid clutter.
How do I build a sales dashboard in Excel?
List your KPIs, collect data in one sheet, then use pivot tables and charts to summarise it. Add slicers to filter by agent and date. This works for small teams, but updating data manually becomes difficult as the team and lead volume grow.
How often should I check my sales dashboard?
Check key numbers daily, such as calls, idle time and overdue follow-ups. Review conversion and coaching points weekly, and look at targets, pipeline health and revenue trends monthly. A regular routine matters more than the exact schedule.
What is the difference between a sales dashboard and a sales report?
A dashboard shows current performance at a glance and updates frequently. A report is usually a detailed, fixed-period summary, such as monthly sales. Most teams need both: dashboards for daily decisions and reports for deeper review.
Can a CRM create a sales dashboard automatically?
Yes, many CRMs build dashboards from the data your team logs, such as calls, lead stages and deal values. The dashboard is only as accurate as that data, so make sure agents log outcomes consistently.
Which sales dashboard metrics matter most for telecalling teams?
Calls made, talk time, connection rate, follow-up completion, lead-stage movement and conversion rate are the most useful. Together they show whether agents are reaching customers and moving leads forward, not just dialling numbers.
Conclusion
A sales performance dashboard works best when it is simple, accurate and used every day. Decide what you want to track, pick a small set of KPIs, keep your data in one place, and review the numbers as a team for coaching rather than blame.
If your team is outgrowing spreadsheets, a CRM for telecallers with built-in reporting can reduce manual work and give you a clearer view of your sales floor. Start with the basics, and improve the dashboard as your team grows.