Introduction
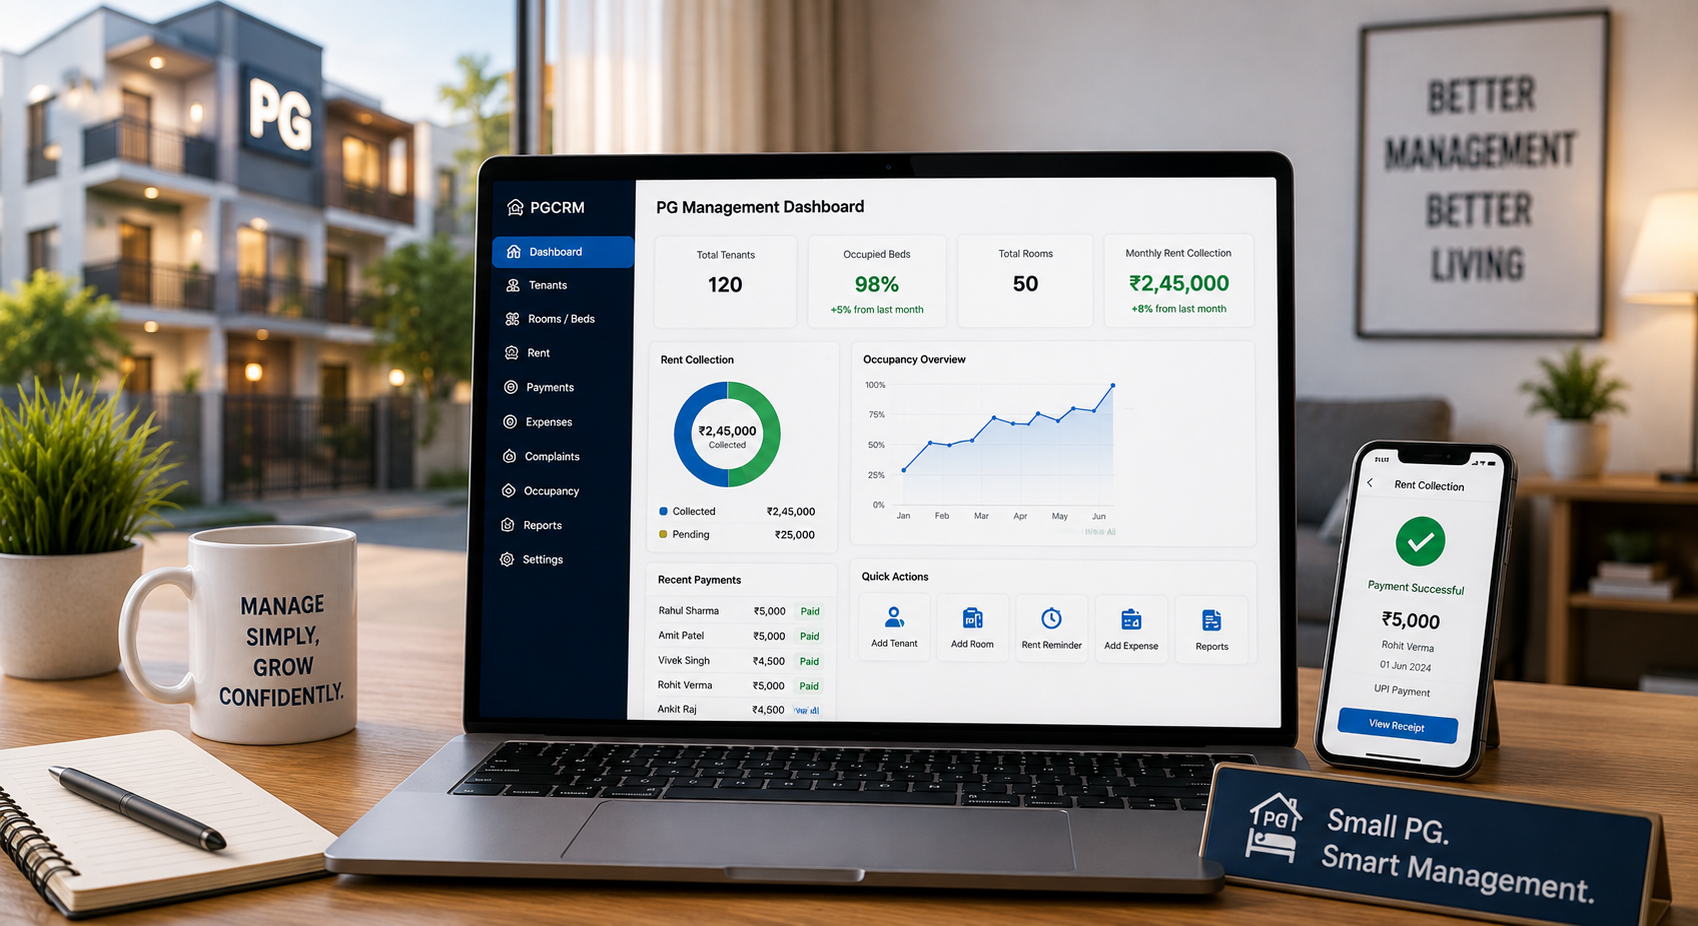
Two PGs can charge similar rent and still perform very differently once you look past the headline numbers. Revenue per bed is the metric that reveals the difference; it shows how much income each bed actually generates once vacancies, discounts, and turnover are factored in. Unlike simply looking at rent per bed on paper, this calculation reflects what you’re actually earning across your property. A PG and hostel management software that tracks occupancy and rent accurately makes this calculation far easier than piecing it together from manual records.
This guide explains what revenue per bed means, how to calculate it step by step, and how to use the figure to evaluate your PG’s actual performance.
What Is Revenue Per Bed?
Direct answer: Revenue per bed is the average income generated by each bed in your PG over a specific period, calculated by dividing total rental income by the total number of available beds, not just occupied ones.
This distinction matters. Rent per bed tells you what a tenant pays when a bed is occupied. This metric tells you what each bed actually earns on average, including the ones sitting vacant.
Why This Metric Matters More Than Rent Per Bed Alone
Rent per bed only reflects pricing. It doesn’t account for:
- Vacant beds that generate no income during a period.
- Partial-month occupancy, when tenants move in or out mid-cycle.
- Discounts or negotiated rates that reduce actual collected rent below the listed price.
- Delayed or missed payments that affect actual income for the period.
This figure captures all of this, giving a more accurate picture of how your property is really performing financially.
The Formula for Revenue Per Bed
Direct answer: Revenue per bed equals total rental income collected during a period divided by the total number of available beds in your property, regardless of whether each bed was occupied for the full period.
The formula looks like this:
Revenue Per Bed = Total Rental Income ÷ Total Available Beds
This differs from “income per occupied bed”, which only divides by beds that were actually filled. Both metrics are useful, but they answer different questions.
Step 1: Calculate Total Rental Income for the Period
Add up all rent actually collected during your chosen period — typically a month.
- Include all payment methods, whether cash or UPI.
- Use actual collected amounts, not the listed rent rate, since discounts or partial payments affect the real figure.
- Choose a consistent period, such as a calendar month, for easier comparison over time.
Step 2: Determine Total Available Beds
This is the total number of beds in your property, regardless of occupancy status during the period.
- Count every bed, including those temporarily vacant.
- Exclude beds under renovation or unavailable for other reasons if they weren’t actually available to rent during that period.
Step 3: Apply the Formula
Illustrative Example (Hypothetical Numbers)
To demonstrate the calculation, consider a simplified example using illustrative figures:
- Total available beds: 20
- Total rental income collected in the month: ₹96,000
Result = ₹96,000 ÷ 20 = ₹4,800 per bed
In this hypothetical scenario, each bed generated an average of ₹4,800 for the month — even though some beds may have been vacant or occupied at different rates.
This example uses made-up figures purely to demonstrate the calculation method. Apply your own income and bed count to get a number relevant to your property.
Revenue Per Bed vs Income Per Occupied Bed
| Metric | What It Measures | When It’s Useful |
|---|---|---|
| Revenue per bed | Average income across all beds, including vacant ones | Reflects overall property performance |
| Income per occupied bed | Average income only from filled beds | Reflects pricing effectiveness when occupied |
| Rent per bed (listed rate) | The price charged, not actual collected income | Useful for pricing comparisons only |
Comparing all three gives a fuller picture: a gap between the first two figures often signals a vacancy problem, while a gap between the listed rate and actual collections often signals a discount or collection issue.
How to Use This Metric to Evaluate Performance
1. Track It Over Time
Calculating this figure monthly lets you spot trends; a declining number may signal rising vacancies or collection issues, even if your listed rent hasn’t changed.
2. Compare Across Room Types
If your PG has different room types at different rates, calculating this figure separately for each type can reveal which room categories perform better relative to their pricing.
3. Compare Against Your Break-Even Point
Direct answer: Comparing revenue per bed against your break-even figure shows whether your average income per bed is high enough to cover costs, offering a quick profitability check without recalculating full occupancy numbers.
If the result sits close to or below your break-even level, it’s a signal to review occupancy, pricing, or costs.
4. Use It When Evaluating Expansion
When considering a new property, estimating this figure based on planned rent and realistic occupancy helps set more grounded expectations than relying on listed rent alone.
Common Mistakes When Calculating This Metric
- Using listed rent instead of actual collected income, which overstates real performance.
- Dividing by occupied beds only, when the goal is to measure overall property performance including vacancies.
- Mixing time periods inconsistently, comparing a full month against a partial month without adjustment.
- Ignoring room type differences when a single average masks meaningful performance gaps between categories.
- Calculating once and never repeating it, missing trends that only become visible over multiple periods.
How Accurate Tracking Supports This Calculation
Calculating revenue per bed accurately depends on having reliable rent collection and occupancy data for each period. Using PG management software such as PGCRM can help owners centralise tenant records, rent tracking, occupancy information, and daily operations — making it easier to pull the actual collected income and bed counts this calculation needs.
Specifically, this kind of tracking supports:
- Rent tracking, giving a clear record of income actually collected rather than just listed rates.
- Occupancy tracking, showing exactly how many beds were available and filled during a given period.
- Reports, which can help summarise income trends across months without manual recalculation.
Without organised records, this calculation often relies on rough estimates, reducing its usefulness for tracking real performance over time.
Frequently Asked Questions
What’s the difference between revenue per bed and rent per bed? Rent per bed reflects the listed price charged for a bed, while this metric reflects the actual average income earned per bed, accounting for vacancies, discounts, and collection issues. It gives a more accurate picture of real financial performance.
How often should I calculate revenue per bed? Calculating it monthly is common, since it allows you to track trends over time and spot issues like rising vacancies or declining collections early, rather than only noticing problems after several months have passed.
Why might my figure be lower than my listed rent? This typically happens due to vacant beds, partial-month occupancy, negotiated discounts, or missed and delayed payments, all of which reduce actual collected income below what your listed rent rate would suggest.
Should I calculate revenue per bed separately for different room types? Yes, if your PG has significantly different rent rates across room types, calculating this figure separately for each can reveal which categories are performing well and which may need pricing or occupancy adjustments.
How does this metric relate to my break-even point? Comparing revenue per bed against your break-even figure offers a quick way to check profitability. If your number falls below that threshold, it signals a need to review occupancy, pricing, or costs.
Can this calculation help when planning to expand to a new property? Yes, estimating expected income per bed for a new property, based on realistic occupancy rather than listed rent alone, helps set more accurate financial expectations before committing to expansion.
Conclusion
Revenue per bed gives PG owners a clearer, more realistic view of financial performance than listed rent alone, accounting for vacancies, discounts, and actual collections. Tracking this figure consistently helps you spot trends, evaluate pricing, and make more informed decisions about your property. Explore PGCRM to simplify your PG and hostel management, and keep the rent and occupancy records you need for accurate calculations organised in one place.