Field Sales Performance Metrics: KPIs Every Manager Needs
If you’re managing a field sales team, you already know the monthly revenue number only tells you what happened — not why. A rep who missed target might have made twelve visits or two. A rep who hit target might be about to burn out. Without the right field sales performance metrics, you’re managing outcomes instead of the behaviors that drive them.
This guide breaks down the KPIs that actually matter for field sales teams, why each one deserves a place on your dashboard, and how to turn the numbers into action. Whether you manage five reps or five hundred, the goal is the same: catch problems early, coach with evidence instead of guesswork, and give your best performers a reason to stay that way.
Why Field Sales KPIs Are Different From Inside Sales Metrics
Inside sales teams work inside a CRM all day, so most of their activity is captured automatically. Field sales is different. Reps are on the road, in customer offices, or at retail outlets — often outside the reach of a laptop or a manager’s line of sight.
That gap creates two problems. First, managers often only see lagging indicators like closed deals or monthly revenue, with no visibility into the daily activity that produced (or failed to produce) those results. Second, without objective location and visit data, it’s genuinely hard to tell the difference between a rep who’s struggling with the market and one who’s simply not putting in the visits.
Good field sales performance metrics solve both problems by connecting activity, effort, and outcome in one view.
The Core Categories of Field Sales KPIs
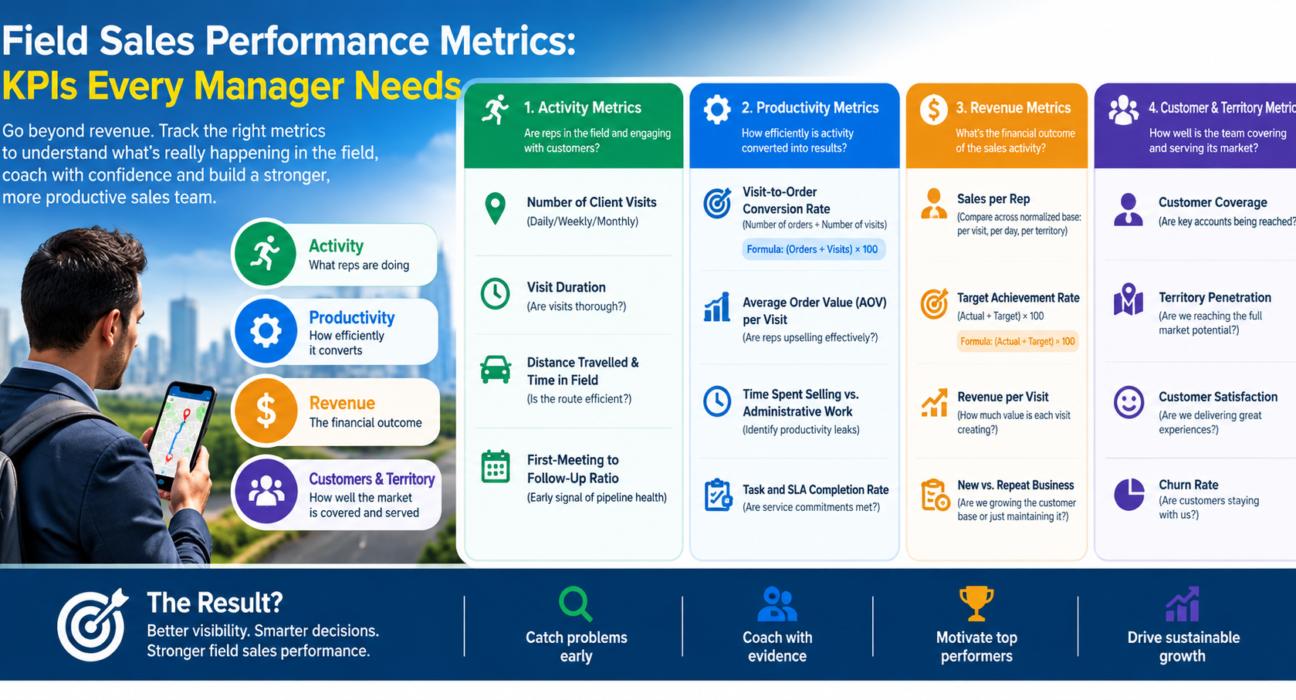
Most useful field sales metrics fall into four categories:
- Activity metrics — what reps are actually doing (visits, calls, time in field)
- Productivity metrics — how efficiently that activity is converted into results
- Revenue metrics — the financial outcome of sales activity
- Customer and territory metrics — how well the team is covering and serving its market
Tracking only revenue metrics tells you the score. Tracking all four tells you why the score is what it is.
1. Activity Metrics
Number of Client Visits (Daily/Weekly/Monthly)
This is the foundation metric. It answers a simple question: is the rep actually in the field, in front of customers? A consistent drop in visit count is often the earliest warning sign of a bigger performance issue — long before it shows up in revenue.
Visit Duration
Total visits matter less if each one lasts two minutes. Visit duration, tracked alongside visit count, helps you tell the difference between reps who are thorough and reps who are just checking boxes.
Distance Travelled and Time in Field
For teams covering large territories, distance and time-on-road data help evaluate whether a rep’s route is efficient or whether they’re spending more time driving than selling. This is also where [Internal Link Opportunity: Route Planning feature page] and beat planning tools become relevant — poorly planned routes quietly eat into selling time every single day.
First-Meeting to Follow-Up Ratio
How many first meetings actually lead to a scheduled follow-up? This is an early signal of pipeline health, well before a deal closes or dies.
2. Productivity Metrics
Visit-to-Order Conversion Rate
This is one of the most important field sales performance metrics because it isolates skill and quality from sheer effort. Two reps might make the same number of visits, but if one converts 30% of them into orders and the other converts 8%, that’s a coaching opportunity, not a workload problem.
Formula: (Number of orders ÷ Number of visits) × 100
Average Order Value (AOV) per Visit
Tracking AOV per visit — not just per deal — helps you see whether reps are upselling effectively or leaving revenue on the table during visits they’ve already made.
Time Spent Selling vs. Administrative Work
Field reps often lose hours to manual reporting, paperwork, and expense claims. Measuring the ratio of selling time to admin time reveals hidden productivity leaks. This is a common area where digital field visit management and automated reporting tools show a measurable difference, since reps stop re-entering the same information twice.
Task and SLA Completion Rate
For teams with service commitments alongside sales (installations, deliveries, follow-up visits within a set window), SLA completion rate measures whether the team is meeting the commitments made to customers.
3. Revenue Metrics
Sales per Rep
The classic metric, but most useful when compared across a normalized base — sales per visit, sales per working day, or sales per territory — rather than in isolation.
Target Achievement Rate
Formula: (Actual sales ÷ Target sales) × 100
This should always be viewed alongside activity metrics. A rep at 60% of target with a strong visit and conversion rate needs a different conversation than one at 60% of target with low activity.
Revenue per Territory
Comparing revenue output across territories — adjusted for territory size and customer density — helps identify whether underperformance is a rep issue or a territory design issue.
Collection Efficiency
For field sales teams that also handle payment collection, tracking how much outstanding revenue is collected on time is a direct measure of both sales quality and cash flow health. This connects closely to collection management processes, since delayed collections often trace back to poor visit follow-through.
4. Customer and Territory Metrics
Customer Coverage Rate
Formula: (Number of customers visited ÷ Total customers assigned) × 100
This shows whether a rep is servicing their full customer base or repeatedly visiting the same easy accounts while neglecting others.
Visit Frequency per Customer
Some accounts need weekly touchpoints; others need monthly ones. Comparing planned versus actual visit frequency by customer tier reveals whether high-value accounts are getting the attention they deserve.
New Customer Acquisition Rate
Tracks how effectively reps are expanding the customer base rather than only servicing existing accounts.
Customer Visit Verification
This isn’t a KPI in itself, but it underpins the accuracy of every metric above. If visit data can be manually entered without verification, reported numbers can drift from reality. Location-based and photo/geofence-based visit verification ensures the activity metrics you’re tracking are actually trustworthy.
Field Sales KPIs at a Glance
| Category | KPI | What It Reveals |
|---|---|---|
| Activity | Visits per rep | Effort and consistency |
| Activity | Visit duration | Depth of engagement |
| Activity | Distance/time in field | Route efficiency |
| Productivity | Visit-to-order conversion | Sales effectiveness |
| Productivity | Selling vs. admin time | Hidden time leaks |
| Revenue | Target achievement rate | Overall performance |
| Revenue | Collection efficiency | Cash flow health |
| Customer | Coverage rate | Territory management |
| Customer | Visit frequency by tier | Account prioritization |
Common Challenges in Tracking Field Sales KPIs
Manual reporting delays. When reps log visits and orders at the end of the day (or week) from memory, data quality suffers and managers lose real-time visibility.
No location verification. Without GPS-based check-ins, it’s difficult to confirm that a logged visit actually happened where and when it was reported.
Data scattered across spreadsheets and messaging apps. Many field teams still track KPIs through a patchwork of Excel sheets, WhatsApp updates, and phone calls, which makes consistent, comparable reporting nearly impossible.
Metrics without context. Looking at a single number — like total sales — without the activity data behind it leads to reactive, not preventive, management.
Best Practices for Using Field Sales Performance Metrics
Combine leading and lagging indicators. Revenue is a lagging indicator; visits and conversion rate are leading indicators. Track both, and weight coaching conversations toward the leading ones, since they’re what you can actually influence this week.
Set benchmarks by territory type, not a single company-wide number. A rep covering a dense urban territory and one covering a rural, spread-out territory shouldn’t be measured against the same visit or travel-time benchmark.
Review metrics on a consistent cadence. Weekly for activity and productivity metrics, monthly for revenue and territory metrics. Reviewing everything only once a month means problems compound before anyone notices.
Share metrics with reps, not just managers. Reps who can see their own conversion rate and coverage numbers tend to self-correct faster than those who only hear about performance in a review meeting.
Automate data capture wherever possible. The more manual the reporting process, the less reliable — and less real-time — the data becomes.
How Field Force Management Software Helps
Manually collecting and reconciling all of the metrics above is realistic for a team of two or three reps. It stops being realistic once a team grows, covers multiple territories, or needs same-day visibility into performance.
This is where field force management software becomes practical rather than optional. Businesses looking to simplify these processes can use field force management software such as FieldExecutives to automatically capture visit data through GPS-based check-ins, track field employee movement in real time, and generate reports on visit frequency, conversion, and territory coverage without relying on manual entry.
Specifically, this kind of platform typically supports:
- [Internal Link Opportunity: Field Employee Tracking / GPS Tracking feature page] — for accurate, real-time visibility into rep location and movement
- [Internal Link Opportunity: Field Visit Management feature page] — for logging and verifying customer visits with time and location stamps
- [Internal Link Opportunity: Real-Time Reporting feature page] — for dashboards that surface the KPIs covered in this article without manual compilation
- [Internal Link Opportunity: Beat Planning / Route Planning feature page] — for optimizing territory coverage and reducing unproductive travel time
- [Internal Link Opportunity: Expense and Collection Management feature page] — for tying financial metrics like collection efficiency back to individual visits
The goal isn’t to replace good sales management with a dashboard — it’s to give managers accurate, current data so their coaching and decisions are based on what’s actually happening in the field.
Conclusion
Field sales performance metrics only create value when they’re tracked consistently, viewed together rather than in isolation, and used to guide action — not just filed into a monthly report. Activity metrics tell you where effort is going, productivity metrics tell you how well that effort converts, revenue metrics confirm the outcome, and customer metrics show whether your market is being served the way it should be.
Getting this right by hand is possible for small teams, but it gets harder — and less accurate — as the team grows. Platforms like FieldExecutives are built to automate the data collection side of this, so managers can spend their time coaching reps and refining strategy instead of chasing spreadsheets.